题目内容
(请给出正确答案)
题目内容
(请给出正确答案)
[主观题]
the charts below show the results of a survey about what people of different age groups sa
The charts below show the results of a survey about what people of different age groups say makes them most happy. Summarize the information by selecting and reporting the main features, make comparisons where relevant and use the writing skill: combining visual tools with text that we have learned in this unit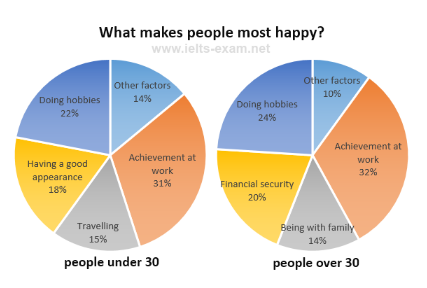
提问人:网友ninver
发布时间:2022-01-07

 如搜索结果不匹配,请