题目内容
(请给出正确答案)
题目内容
(请给出正确答案)
When describing a chart/figure/table, you are advi...
When describing a chart/figure/table, you are advised to follow four stages. Stage 1: Introduce the topic: Describe the general topic the chart/figure/table concerns, and give background information. Stage 2: Explain what the chart/figure/table shows and briefly expand on the title of the chart/figure/table by providing more details, such as what is shown by each axis on a graph, or each column in a table. Stage 3: Highlight the information of particular interest or relevance, focusing on a new aspect of the information. Stage 4: Comment on the information by emphasising the significance of the information to the essay or report more generally, or on the limitations of the information. The following sentences are taken from a report on Global Greenhouse Gas Emissions Data. The pie chart shows the emissions by countries. Identify the corresponding stages of the sentences describing the chart and re-order them to make the description logical.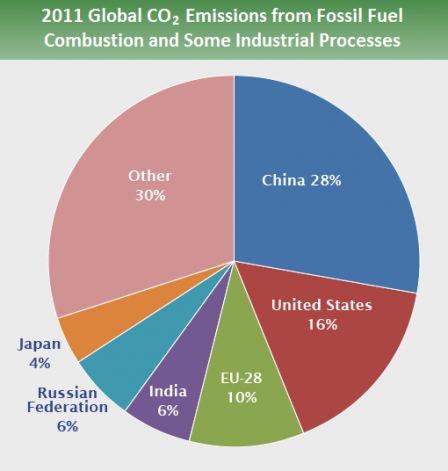 Source: Boden, T.A., Marland, G., and Andres, R.J. (2015). National CO2 Emissions from Fossil-Fuel Burning, Cement Manufacture, and Gas Flaring: 1751-2011, Carbon Dioxide Information Analysis Center, Oak Ridge National Laboratory, U.S. Department of Energy, doi 10.3334/CDIAC/00001_V2015 ❶ These data include CO2 emissions from fossil fuel combustion, as well as cement manufacturing and gas flaring. ❷ Together, these sources represent a large proportion of total global CO2 emissions. ❸ In areas such as the United States and Europe, changes in land use associated with human activities have the net effect of absorbing CO2, partially offsetting the emissions from deforestation in other regions. ❹ In 2011, the top carbon dioxide (CO2) emitters were China, the United States, the European Union, India, the Russian Federation, Japan, and Canada. ❺ However, changes in land use can be important: estimates indicate that net global greenhouse gas emissions from agriculture, forestry, and other land use were over 8 billion metric tons of CO2 equivalent, or about 24% of total global greenhouse gas emissions. ❻ Emissions and sinks related to changes in land use are not included in these estimates. Order the sentences in the following form: 2-3-1-4...

 如搜索结果不匹配,请